This page looks at ways to improve energy use in the United States and world.
LINK TO SLIDES USED IN CLASS PRESENTATION
Transportation Sector
Introduction
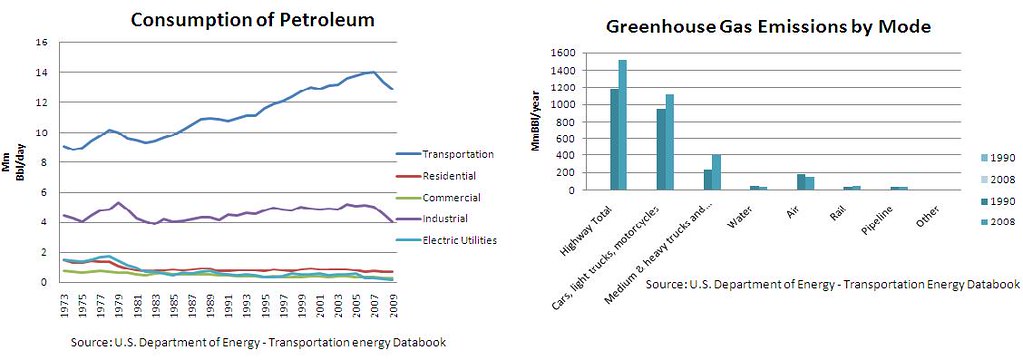
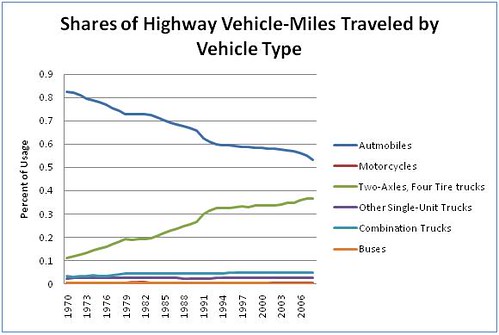
As the following graphs indicate, transportation plays a substantial role in the United States’ ever growing demand for petroleum products. The transportation sector consumed 12.9 million barrels of petroleum (71%) in 2009 and 28% of total energy in the United States2. Recent concerns regarding depleting petroleum supplies and adverse environmental effects of greenhouse gases have triggered interests in automobile efficiency by governments and consumers, alike. Transportation accounts for nearly 18% of total U.S. greenhouse gas (GHG) emissions and 22% of CO₂. Motor gasoline, the primary fuel for passenger vehicles, has been responsible for approximately 60% of U.S. carbon dioxide emissions over the last 20 years3. Gasoline accounts for 60% of all liquid fuels. This means that the average passenger vehicle accounts for…
• 17% of all energy (.6 x 28)
• 18% CO2 emission (.6 x 33)

4
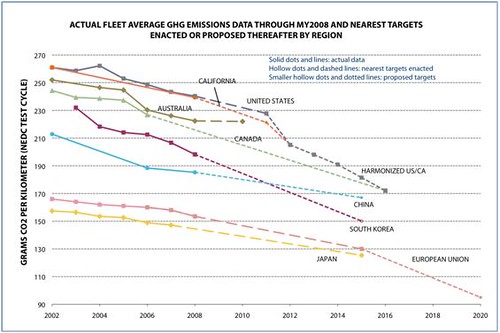
With 780.5 vehicles per thousand people, automobile ownership in the U.S. is more prevalent than in any other country of comparable size. This denotes the global significance of our transportations habits. In this aspect we are the greatest contributor to issues such as depleting resources and environmental degradation which have global effects. As a developed leader in the world’s economy it is imperative to adhere to the highest standards of transportation efficiency. Unfortunately, the United States lags far behind many of its developed counterparts. A debate arises between those who believe components such as price and competition will create equilibrium in the market resulting in efficient energy use and those who insist government intervention is imperative to incentivize efficient behavior, thereby, avoiding complete resource depletion and hazardous environmental repercussions.
5
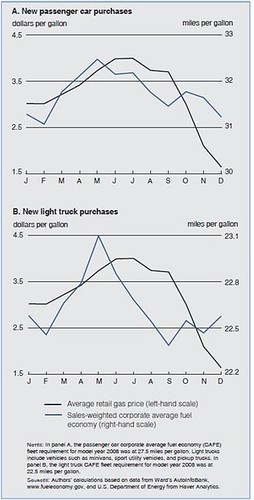
It is interesting to point out the relationship, or lack thereof, between vehicle buyer behavior and the price of petroleum within the last year. The following graph shows the purchase behavior of cars and light trucks in 2008 when government has already notified the public of new efficiency standards. This data challenges the general assumption under a free market approach that consumers will choose more efficient vehicles if presented with higher prices. It is also possible that consumers will only react to severely high prices maintained for a relatively long period of time.
When considering a policy it is important to recognize additional costs affecting the government (tax payers), manufacturers, and consumers. Future benefits must outweight these costs in order to justify implementation.
Various energy policies to motivate efficient transportation behavior include:
• Fuel taxes
• Efficiency standards
• Financial subsidies
• Feebates
• Usage based insurance
Fuel Tax
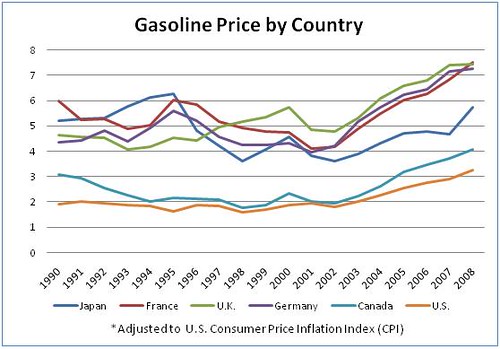
Fuel taxes are by far the most direct and simplest form of transportation energy policy. By taxing fuel we assume that markets are competitive, social costs are internalized, and the private consumers by themselves will reach an efficient solution7. Smaller vehicle size in Europe and other countries relative to the United States is apparent. This could be attributed in large part to much higher fuel taxes which cause consumers to internalize the social costs by paying a higher price. European drivers are much more likely to choose a diesel fueled vehicle as a result of relatively lower diesel taxes. High prices provide a disincentive for fuel consumption, reducing excessive acceleration, speeding, and overall vehicles miles driven (VMT), and in turn reduces emissions. Infrastructure costs for implementing the policy are low and require little capital investment. Despite these benefits, fuel taxes are unpopular among consumer because they dislike paying higher prices. Many economists oppose the idea as well because raising prices can cause an economic deadweight loss, however, much of this can be mitigated is revenues are returned to consumers by reducing taxes.
Efficiency Standards (CAFE)
The U.S. Congress enacted the Energy Policy and Conservation Act of 1975 which established Corporate Average Fuel Economy (CAFE) regulations in the United States. CAFE regulations provide a quantitative target and provide the base for fuel efficiency standards in the United States. Regulations were imposed in response to the oil crisis that occurred in the early 1970’s in an attempt to improve the average fuel economy of cars and light trucks (trucks, vans and sport utility vehicles under 8,500 lbs.) sold in the U.S. Fuel efficiency standards gradually rose until about the mid 1980’s, at this time automakers had met standards for Light Duty Vehicles (LDVs) and the price of liquid fuels dropped dramatically. Little attention was given to fuel efficiency and standards plateued until 2009. As a result, consumer preference for larger, heavier, less fuel efficient vehicles began to increase. The following graph demonstrates this change, showing a general shift in ownership from automobiles to trucks.
NEW CAFE
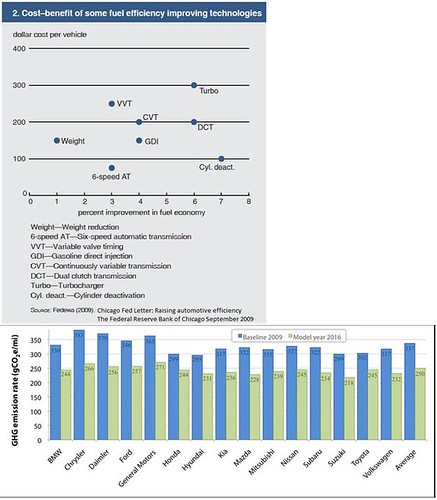
Recently, the EPA and National Highway Traffic Safety Administration (NHTSA) have made a joint effort to address automobile efficiency and GHG emissions by creating new CAFE standards, we may refer to them as CAFE 2. The three main objectives of CAFE 2 are energy efficiency, fuel efficiency (MPG) and reduction in GHG emissions. The new changes will include standards for Heavy Duty Vehicles and amendments to existing standards for Light Duty Vehicles (LDVs). They apply to passenger cars, LDVs, and medium-duty vehicles and will require an estimated average emissions level of 250 grams of carbon dioxide per mile by year 2016. This equivocates to 35.5 miles per gallon; however, miles per gallon may vary if additional carbon reducing changes are made such as more efficient air conditioning systems (see cost benefit graph for other technologies)10. The following bar graph compares 2010 GHG objectives with current 2009 vehicle models.
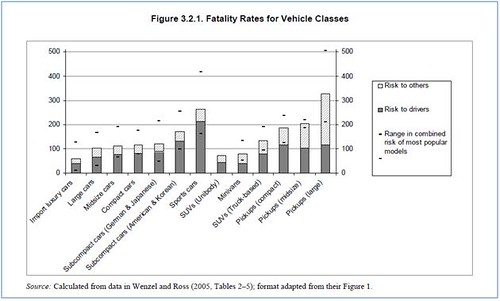
In contrast with the first CAFE, both LDVs and HDVs are expected to adhere to standards of maintaining a small “footprint” so vehicles of the same size do not compromise safety to achieve fuel efficiency by encouraging the use of light-weight materials while maintaining vehicle size. By using the footprint method, selling more small vehicles does not help manufacturers meet footprint standards. It is important to note the incentive for lighter vehicles on the grounds of safety concerns. Some technological advancements are necessary to reach efficiency standards while maintain current safety rating. However, larger vehicles are only safer for its occupant not for anyone colliding with it12. In fact the overall risk (including risk to others) is generally higher with larger vehicles. Another main disadvantage is that the policy gives the user no incentive to use other means of reducing fuel consumption, such as limiting excessive acceleration and reducing total vehicle miles drive (VMD). In fact, there is greater incentive for consumers to drive these vehicles because they pay less per mile.
13
Feebates
It should be noted that all automobile manufacturers do not have to adhere to these standards. Many high end companies such as Maserati, Mercedes-Benz, Jaguar, and Porsche have opted to pay fines14. Consumers internalize the cost of additional fuel intensity (the reciprocal of fuel efficiency) by paying a higher price. This is essentially the idea of a feebate, however, with the feebate method consumers are charged for their inefficient behavior and the money is used to provide other consumers with rebates for efficient vehicles. An efficiency target is established, similar to the CAFE regulation, and is reached by those who chose to the purchase of more efficient vehicles. In a NEMS-RFF study by Kenneth Small, feebates created greater efficiency gains though the use of hybrid and diesel than the CASE standard but it also provides incentive for greater VMD.
Usage Insurance Policies
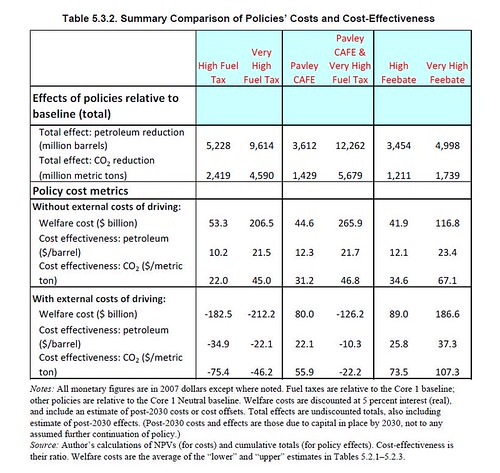
A fuel tax can be used in conjunction with efficiency standards or feebates would force drivers to internalize some of the social costs and mitigate the disadvantage of inefficient driving. Small conducted an analysis over the combination of these two policies and found results to be more efficient that either policy by itself. The graph below gives an overview of the policies, using the NEMS model. Some have proposed the idea of a usage based insurance policy to a similar effect. General insurance policies charge the fixed amount regardless of quantity of time spent driving. In terms of economics, this means that the person who drives more often and greater distances, the freerider, is benefiting from those who drive less frequently and fewer miles. A usage based insurance policy would internalize the social costs of driving and change overall consumer habits.
Payback Period and Discount Rate
With government rebates and feebates, the additional initial cost of fuel efficiency is paid by the government and inefficient consumers; some would say the manufacturer as well. However, consumers can still benefit from efficiency without the help from government policies. The present discount period value and payback period are essential in determining when the buyer will receive benefit rather than loss from the additional cost spent on their initial investment to receive efficiency. This issue becomes specifically important for consumers considering alternative fuel vehicles. The basic definition of a payback period is the amount of time it takes to regain your initial investment. In the case of efficient vehicles it would be the additional cost incurred by buying a vehicle that runs off of alternative fuel rather than a conventional vehicle divided by the amount saved on fuel per year. Factors to determine the amount saved include: the difference between the new technology and conventional technology, price differences among fuels, and vehicle fuel efficiencies, and annual distance traveled. Some key elements that can cause the actual payback period to vary from the predicted are types of usage (highway vs. traffic) and actual miles driven. However, the most importantly, the payback period does not take into consideration the time value of money (present discounted value). When calculating a cost benefit analysis it is crucial to take into account that your money is worth more in the future. Otherwise, if a consumer reads that the payback period for a hyrbid is 5 years of a CNG vehicle is 8 years without considering the time value of time they underestimates the true economic benefits of their investment.
Residential and Commercial Sector
There are many drivers in the construction and use of residential and commercial buildings which impact energy consumption and in turn fossil fuel generated carbon releases into the atmosphere. Drivers which influence building construction include: population, economic growth, building size, energy prices, and the efficiency with which energy service demands are met. Services demanded of buildings which require significant energy use include: lighting, temperature control, water heating, as well as tasks specific to the domestic and work environments such as cooking, refrigeration, computing and electronic entertainment. The nation has approximately 114 million households, and 4.7 million commercial buildings. Together both commercial and residential sectors account for more than 40% on of total U.S. energy use.15
Electricity is the largest source of energy for buildings, with a smaller contribution made by natural gas, and heating oil. 70 % of U.S. electricity is generated by burning the fossil fuels, coal, petroleum, and natural gas 20% is nuclear and the remainder is cobbled together from renewable sources such hydro electric and wind . Overall growth in the U.S. housing market, despite recent downturns, has driven an increase in electricity consumption. The burning of fuels to supply buildings with electricity makes buildings responsible for the largest share of U.S. carbon dioxide emissions.16
Losses in efficiency are incurred during conversion from one source to another, and from the transportation, and distribution of electricity over power lines. At present losses are calculated to be twice the size of actual purchases. Meanwhile both residential and commercial energy use is growing accounting for, in turn, a growing share of energy consumption. Though use in the residential sector is higher, commercial use is growing faster.17
Residential Energy Use
Residential buildings are defined as detached and attached homes apartments and mobile homes. Growth in household wealth and other factors have spurred demand for larger homes and more energy services. Increasing energy consumption per household and increased saturation of appliances and equipment such as computer and entertainment systems has resulted in larger demand for energy, in particular electricity.
Growth in housing unit size and demand for energy services has been partially counteracted by improvements and energy intensity. Over the past 3 decades, refrigeration, ventilation, insulation, windows and temperature control have become more efficient. Such contributions have resulted in a decreased in energy intensity over the past 25 years of 9%, but over this same period the increases in number and size of homes has caused greater increases.18
Residential Construction Industry
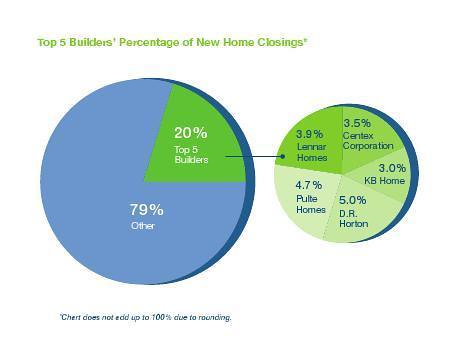
Every year in the U.S. 2 million new homes are built and 27 million are retrofitted. A slow trend in consolidation (larger firms are buying out smaller firms) has resulted in the top 5 builders in the country accounting for over 20 % of the closings on new homes. As a result of their market impact it is of vital importance to enable and require energy efficient techniques from the larger companies in the market.19
Residential Energy Use
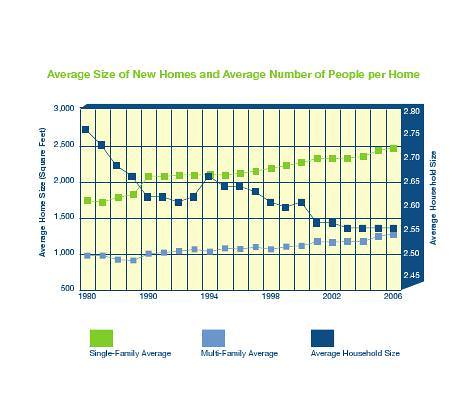
Since 1980 housing units have grown larger while the number of occupants has decreased. As house size grows, so does residential energy consumption with end-uses such as air conditioners, dishwashers, computers TVs and small appliances driving much of the growth.20
Primary Residential End-Use Splits
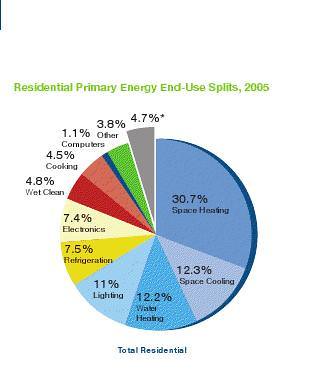
Most of the energy use in a house is devoted to temperature control of space and water, factors which are most influenced by home size and number of occupants. Despite increases in efficiency these along with lighting these are the largest energy end-users in a home.21
Programs and Initiatives Aimed at Efficiency Solutions
The U.S. Department of Energy is tasked with setting standards for equipment and appliances in order to reach the maximum level of energy efficiency that is technically feasible and economically justified. The department attempts to establish standards that maximize consumer benefits and minimize negative impacts on manufacturers and other stake holders. Further, in 2008 the DOE released a schedule for setting new appliance efficiency standards, and a plan to address a rule making backlog in order to meet the requirements of the Energy Policy and Conservation act, as modified by the Energy policy act of 2005.
State Energy offices can have an impact on efficiency though standards, incentives and efficiency programs. Utility companies, working alone or in consort with state energy offices, offer incentives for agency improvements and sponsor efficiency programs targeted at achieving peak load reductions.
Tighter sate building energy codes have been a factor in the rise of residential energy efficiency. More new homes are being constructed to meet the target of energy efficiency programs, and 46% of new home buyers cite energy efficiency as a major consideration in their purchasing decisions. According to the DOE it is possible to design and construct new houses that are 30% to 40% lower in energy intensity than the typical house, at little additional cost. However, such homes still hold a very small market share.
Major programs aimed at addressing residential energy efficiency include: Building America, ENERGY STAR, Environments for Living, and LEED.22
Building America
Build America is a DOE sponsored research program that focuses on residential building with the goal of accelerating the development of advanced building technologies, reengineering new and existing homes for energy efficiency and affordability. Specific goals include: developing retrofit strategies to improve existing homes, producing new housing with 40% to 100% less energy use, reducing construction time and waste, and improving builder profitability. All with little or no additional cost
The systems engineering approach is the corner stone of the project. It is a method that unites the traditionally independent disciplines of the industry, architects engineers, builders, equipment manufacturers, and materials suppliers etc into teams that assess structures as a whole and use program benchmarks as a standard of comparison. Typically the process involved consists of first designing, building, testing redesigning retesting and retrofitting spec houses employing system performance analysis using program specific benchmarks. Production housing designs are then finalized before implementing community scale housing projects.23
ENERGY STAR
ENERGY STAR is a joint program of the DOE and the U.S. Environmental Protection Agency created to identify and promote energy-efficient products to reduce green house gas emissions. Additionally the program provides technical information and tools that organizations and consumers can use to choose energy-efficient solutions and best management practices. Boasting $17 billion in cost savings to consumer in 2009 program initiatives have focused on efficient fluorescent lighting, power management, and low standby energy use.24
ENERGY STAR focuses on the residential sector seeing a sizeable opportunity to reduce greenhouse gas emissions through improved energy efficiency, with the main objective of working with manufacturers to identifying products which deliver energy savings and environmental benefit. Easy access is provided to the consumer by hotline and website containing information on 18,000 different products from 1,250 manufacturers. The current goal for public recognition is 60% with recent reports suggesting the public is experiencing confusion about exactly who is behind ENERGY STAR and the goals of the program.25
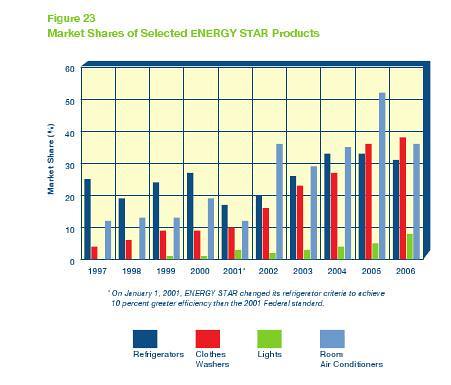
Presently ENERGY STAR has a market presence of approximately 12% and estimated savings of $200 million annually in utility bills. ENERGY STAR appliances are becoming more prevalent in the U.S. although market shares it typically under 40%.26
.
Environments for living
Offered by Masco Home Services, Environments for Living is a national program which provides a package of services to builders in an attempt to apply the principles of building science to new home construction. The program is performance based and does not require builders to use a particular manufacturer’s product. Rather, strict requirements for construction ventilation, improved thermal systems, air pressure balance, internal moisture management combustion safety must be met before certification can be attained. The Environments for Living Certified Green program carries further requirements for water conservation, lighting and appliance efficiency.27
The program offers different levels with progressively stricter requirements. Certified Green delivers 20% energy saving 20% water savings, and a 20% reduction in greenhouse emissions. The Gold Level further requires buildings to perform 15% above IECC code and qualify for the EPA ENERGY STAR label, and the Platinum Level requires buildings to perform 30% above code and qualify for the DOE’s Builder’s Challenge Program.28
LEED
Leadership in Energy and Environmental Design is another green building certification system, a third party system of verification which certifies building and community design utilizing strategies for improved energy savings, water savings, and decreased greenhouse gas emissions. It was developed by the U.S. Green Building Council and was designed to be flexible in application fitting both residential and commercial buildings.29
LEED attempts to deliver improved efficiency results across several specific categories, examples include:
- Sustainable Sites- Development on previously undeveloped land is discouraged in favor of locations w/ close proximity to urban centers as to avoid heavy reliance on transportation, and promotes the use of regionally appropriate landscaping.
- Water and Energy Efficient- Improved efficiency is generally achieved though the use of ENERGY STAR, or otherwise efficient appliances.
- Material and Resource Quality- LEED discourages the production of waste from and overly wasteful methods of construction, and promotes the use of locally harvested sustainable stock and materials.
Compliance with these and other categories is measured by means of a point system which further separates levels of certification into four groups: certified, silver, gold, and platinum.30
Payback Periods
The average payback period for a Building America home is close to 35 years31, while Environments for living claims a shorter period of 6 to 8 years32. LEED offers the best information on payback periods publishing an average for each certification level, with 3 years for minimum certification, 3 to 5 years for silver, 5 to 10 for gold and 10 and more for platinum certification.33 ENERGY STAR offers an array of spreadsheets to calculate payback period on an apliance by appliance basis. Air and water temperature appliences will be discusussed further in the Commercial Sector portion of this Wiki, but basic appliance average payback periods are:
- Clothes Washer – 4.7 years
- Refriderators – 2.8 years
- Dish Washers – 1.2 years
- Televisions – 0 years
- Ovens – 4.1 years34
Commercial Sector
What is the Commercial Sector?
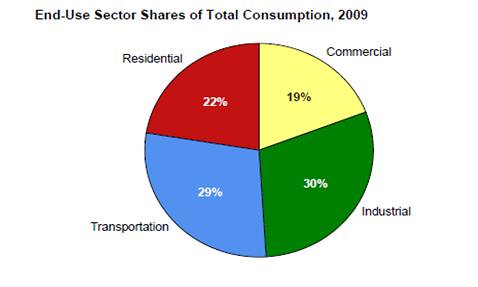
While the most residential buildings are owner occupied (single family, non-rented), the commercial buildings sector is much more multifarious. It consists of service-providing facilities and equipment of a wide variety of structure categories such as: offices, hospitals, schools, police stations, places of worship, warehouses, hotels and shopping malls. Office buildings, the most common type of commercial building, account for 17 % of buildings, floor space, and energy consumed. In 2009, the commercial sector as a whole consumed 19% of end- use energy which is the lowest consumption relative to the other sectors.35
Primary Sources: Natural Gas & Electricity
The uses of energy in this sector are equally diverse; common uses of energy include space heating, water heating, air conditioning, and lighting, refrigeration, cooking, and running a wide variety of other equipment. Furthermore, it is undisputed that every structure has unique and individual energy needs, but the most common sources used to satisfy those needs are electricity and natural gas. The Commercial Building Energy Consumption Survey (CBECS) noted in 2003 that electricity and natural gas account for more than 87% or 6500 trillion Btu of the total energy consumed in the commercial building sector. (This number does account for electrical losses) CBECS is a national sample survey that collects information on the stock of U.S. Commercial Buildings, their energy related characteristics, and their energy consumption and expenditures.
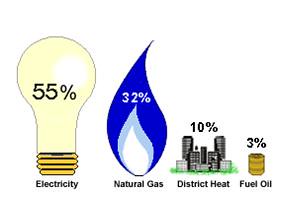
CBECS is conducted on a quadrennial basis and the most recent information available reflects 2003 statistics of 4.9 million buildings and more than 71.6 billion square feet of floor space.Source: U.S. Energy Information Administration, 2003 Commercial Building Energy Consumption Survey
According to CBECS, 32% or 2100 trillion Btu of end-use energy consumed is natural gas. Similar to the Residential sector, it is the primary commercial fuels source for space and water heating, cooking, and drying. It also accounts for 13% of energy used in commercial cooling. Electricity on the other hand, accounts for 55% of sources of commercial end use energy consumption, which is 3.5 quadrillion Btu. Commercial electricity usage has greatly increased from 2.2 quadrillion Btu in 1979. This increase is greatly attributed to the increased use of existing types of equipment in commercial buildings such as computers, office equipment, telecommunications equipment and medical diagnostic and monitoring equipment.36
Commercial Sector Growth
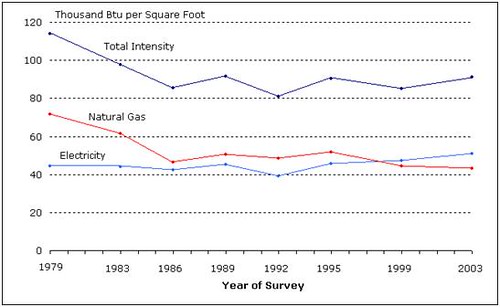
The U.S. adds about 1.6 billion square feet per year – nearly 110,000 buildings annually at the mean size or roughly half a million buildings every five years. Projected growth rates of such sheer magnitude would seemingly directly correlate to increased demand for energy, but over the years the amount of commercial floor space has at times outpaced the increase in demand; therefore, the intensity of total energy use in decline. Since about 1999 however, intensity rates have been increasing at a slow, stable rate. This could be in part due to reducing energy use by means of efficiency and supplemental load reduction: A trend that is likely to be propagated by cost effectiveness and / or regulation.
Nonetheless, the increasing growth rate enables possibilities of improving energy efficiency by: promoting energy efficiency through certain initiatives and programs (some have previously been mentioned while discussing the residential sector); and the Retrofitting of aging structures and incorporating sustainable design into new construction are ways businesses can minimize their environmental impact, lessen America's dependency on foreign power sources and lower energy.37
Regulations and Voluntary Programs
Regulation Concerning the Commercial Sector
The Energy Policy Act of 1992 mandated the Department of Energy (DOE) to support the adoption and enforcement of energy codes in the states. Furthermore, The American Recovery and Reinvestment Act of 2009 provided a new goal for DOE's building codes efforts - 90% compliance with energy code requirements for each state.
- Energy codes specify how buildings must be constructed or perform, and are written in mandatory, enforceable language.
- Standards are published by national organizations such as the American Society of Heating, Refrigerating, and Air-Conditioning Engineers (ASHRAE). Unlike many standards, the ASHRAE 90.1 is written in “mandatory enforceable language”.
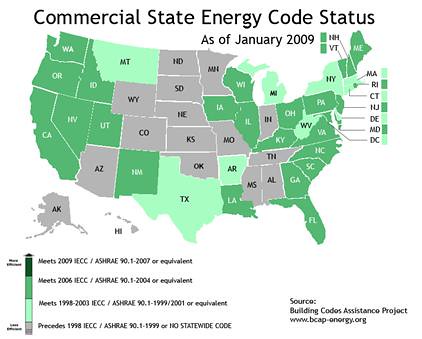
Energy use in commercial buildings is affected by the adoption of commercial energy codes: States or local governments adopt and enforce energy codes for their jurisdictions, and therefore vary greatly upon location. Currently, there are two primary baseline building energy codes and standards that are adopted by states and local jurisdictions - the International Energy Conservation Code (IECC), and the ANSI/ASHRAE/IESNA Standard 90.1 Energy Standard for Buildings Except Low-Rise Residential Buildings (ASHRAE 90.1). However, a separate set of codes and standards apply to buildings constructed or used by any Federal agency.
Additionally, the International Code Council (ICC) is an internationally recognized code development organization. A product of the ICC is the IECC: A subset of international codes and is a model energy code that makes allowances for different climate zones. Just like ASHRAE 90.1, it is also written in mandatory, enforceable language so state and local jurisdictions can easily adopt the model as their energy code.383940
Programs and Initiatives Relative to Efficient Energy Usage in the Commercial Sector
Building Technologies Program (BTP) & Commercial Building Initiative (CBI)
The Commercial Building Initiative (CBI) was launched in August of 2008 by the Department of Energy’s (DOE) Building Technologies Program (BTP) as a government research initiative focused on improving the energy efficiency of new and existing commercial buildings in the United States. It is much like the aforementioned Building for America program aimed at residential efficiency.
CBI focuses on two key areas. First, CBI is conducts research to dramatically improve the efficiency of existing buildings, in which the key focal point is identifying the most cost-effective retrofitting strategies that also improve the safety and comfort of existing buildings. Second, CBI is developing strategies to construct new, marketable buildings that achieve 50% to 70% whole building energy improvements, relative to ASHRAE Standard 90.1-2004.
CBI strives to do the following to support and achieve the goal of maximum efficiency in buildings:
- Promote technology research and development
- Sponsor pilot and demonstration projects across multiple climate zones
- Provide technical assistance to encourage widespread technology adoption
- Develop training materials and programs for builders
- Promote consumer-focused education that makes clear the need for efficiency in new and existing buildings
- Work with code-setting bodies to ensure technologies are properly deployed
- Analyze and propose incentives for builders, landlords, and tenants to ensure that cost-effective investments are made on a life-cycle basis
- Develop targeted tools for measurement and verification of energy savings.
CBI also engages commercial building owners and operators from a variety of industry sectors to help move these technologies from the laboratory to the marketplace.[|EERE]]
Leadership in Environmental Design (LEED)
As it has already been mentioned, LEED was developed by the U.S. Green Building Council (USGBC) and provides building owners and operators a concise framework for identifying and implementing practical and measurable green building design, construction, operations and maintenance solutions. It accomplishes this through a third-party verification system and is internationally recognized. In relation to the commercial buildings market, LEED provides a variety of distinct tools relating to building retrofitting and new construction.
- LEED New Construction (NC) : for new construction or major remodels of commercial buildings or multi-family projects over four floors
- LEED Commercial Interiors (CI): for tenant improvement (commercial interiors) projects not involving an entire building.
- LEED Core and Structure (CS): for the core and shell portions of speculative commercial buildings where tenancy is not known or not a part of the initial construction
- LEED Existing Buildings (EB) : for existing buildings that retroactively wish to improve and benchmark their sustainable building performance
*41
ENERGY STAR
ENERGY STAR, as mentioned before, is a joint program of the U.S. Environmental Protection Agency and the U.S. Department of Energy helping us all save money and protect the environment through energy efficient products and practices. In the commercial Building sector, ENERGY STAR helps protect our environment and prevent climate change through sustainable design by providing information to help architects and building owners make informed decisions about energy efficiency during the design process.42
Primary Uses and Efficiency
The dominant commercial uses of energy (all sources) were lighting (21%) and space heating (36%). Due to this fact, the topic of energy efficiency will be roughly centered on these two uses.43

Lighting
Lighting is the major consumer of energy in commercial buildings and a target for energy savings through use of energy-efficient light sources along with other advanced lighting technologies. Due to lighting systems producing large amounts of heat, energy efficient lighting can also potentially reduce a building’s cooling requirements. Also, upgrading lighting equipment can improve the power quality of a building’s electrical system and/ or electrical capacity.44
There are many options of lighting available but proving which one is most efficient heavily relies upon a commercial structure’s requirements and goals. Popular types of lighting are:
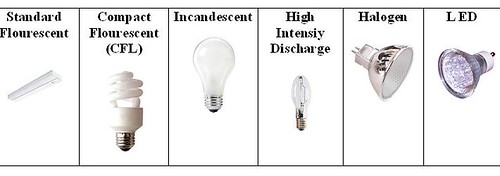
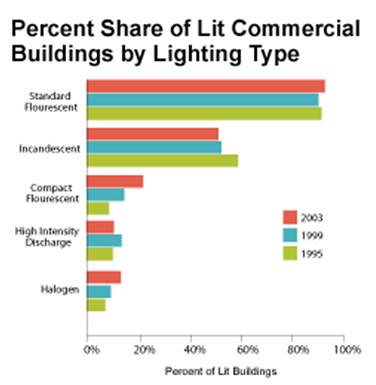
The percentage of commercial buildings with lighting was unchanged between 1995 and 2003; however, three lighting types did show change in usage. Compact fluorescent lamps (CFLs) and halogen lamps showed a significant increase between 1995 and 2003, while the use of incandescent lights declined.
- CFLs were used in twice the share of lit buildings in 2003 than in 1995, going from 10% to 20% of lit buildings.
- The use of halogen lamps nearly doubled, from 7% to 13% of lit buildings.
- Use of incandescent lights was the only lighting type to decline; their use dropped from 59% to just over one-half of lit buildings.
- Standard fluorescent lamps and high intensity discharge lamps showed no significant change in use.45
In reference to the CBECS lighting usage data, the use of CFL lighting is quite popular and is increasing in usage despite the higher costs relative to incandescent lighting. Incandescent lighting has proved to be inefficient in terms of lifespan and watt usage ( 46 more watts used than CFL bulbs).
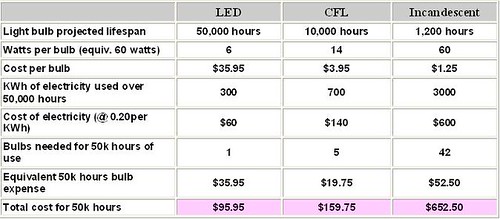
Furthermore, commercial buildings that invest in CFL lights have a short payback period due to the difference in cost for example, 50k hours, as noted above. As for LED lighting within the commercial sector, it is not necessarily a cost beneficial avenue, and is therefore not noted as in depth as CFL and incandescent usage.46
Space Heating and Cooling: HVAC System Efficiency
HVAC: heating, ventilation, and air conditioning systems, used in building design and construction
Within the last couple of decades the efficiency of HVAC equipment has been a topic of increasing attention. Efficiency of these systems was originally targeted for the associated cost benefits and energy savings to combat rising energy prices. More currently, increased awareness of environmental issues and better technologies have led to more concentrated efficiency efforts. There are several methods for making HVAC systems more efficient.47
Forced air systems can double for air conditioning and heating. A couple of benefits of forced air systems, which are now widely applied in churches, schools and high-end residences, are 1) better air conditioned effect 2) up to 15-20% energy saving, and 3) evenly conditioned effect. A drawback is the installation cost, which might be slightly higher than traditional HVAC system.
Geothermal heat pumps (GHP) are among the most efficient heating and cooling technologies currently available. GHP’s rely on the stable, even temperatures of the earth to provide heating cooling and water heating. In comparison to regular heat pumps, GHP’s are initially more costly but they can produce noticeably lower heat bills, 30 to 40% lower, according to the EPA.4849
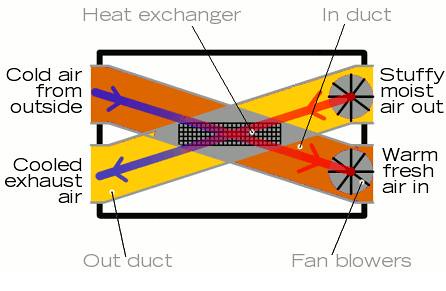
Ventilation Energy Recovery
Ventilation is the least expensive and most energy-efficient way to cool buildings. Ventilation works best when combined with methods to avoid heat buildup in your home; but there are technologies that specifically enhance ventilation and energy efficiency, such as an energy recovery ventilation system. This type of system provides a controlled way of ventilating a home by using a heat exchanger : They heat ventilated air in the winter by transferring heat from the warm inside air being exhausted to the fresh (but cold) supply air. In the summer, the inside air cools the warmer supply air to reduce ventilation cooling costs.
50
Typically, energy recovery ventilation systems can recover about 70%-80% of energy but cost more to install and require more maintenance than other ventilation systems. This in turn lengthens the payback period. However, these systems are most cost-effective in extreme seasonal climates and where fuel costs are high. Also, installation costs can be reduced if there is a sharing of existing ductwork between HVAC systems.51
Furthermore, ENERGY STAR qualified commercial products can possibly save businesses $1.70 per square foot over the life of the equipment. A given example of savings: $12,000 dollars in savings when using ENERGY STAR qualified HVAC equipment in a 12,000 square foot building. In the same example, such equipment could prevent more than 40,000 pounds of greenhouse gas emissions.52
Environmental Policy Act of 2005
The Environmental Policy Act of 2005 created the Energy Efficient Commercial Buildings Tax Deduction, a special financial incentive designed to reduce the initial cost of investing in energy efficient building systems via an accelerated tax deduction.
Under this provision:
- Building owners (or tenants) can write off the complete cost of upgrading a building’s indoor lighting
- HVAC/hot water and building envelope in the year the new equipment is placed in service, capped at $1.80/square foot.
- Alternately, the owner (or tenant) can upgrade one of these three systems to earn the Deduction capped at $0.60/square foot.
- Interior lighting may also be improved using the Interim Lighting Rule, which provides a simplified process to earn the Deduction, capped at $0.30-$0.60/square foot. Improvements are compared to a baseline of ASHRAE 90.1 standards.
Also, The Commercial Buildings Tax Deduction expiration date has been extended twice, most recently by the Energy Independence Act of 2007 (EISA). With this extension, the CBTD can be claimed for qualifying projects completed before January 1, 2014.
With such extensive tax incentives, the cost efficiency of implementing newer, more energy efficient technologies in commercial buildings is greatly affected. By reducing initial investment costs, barriers to such technologies are lowered and the financial feasibility of implementing such innovations is more economical.53
Industrial Sector
Industrial Energy Efficiency
Energy is a fundamental component that is found in almost every good and service in the global market. The benefit to obtaining efficiency will help cut cost when using energy itself. In the United States market, the industrial sector is a large fraction of consumption of energy. Addressing changes and welcoming innovation in technology in this market will lower the United States consumption thus making it more efficient.

Energy Sustainability
In order to reach energy sustainability, as a society we must take the initiative to strive towards efficiency by focusing on improvements and in the development of new technologies. With increasing energy prices and rising economic concerns that have surfaced it is vital to increase options in alternatives of energy sources. The concept of energy efficiency in the industry sector faces many obstacles that prevent potential progress in the development of energy efficient programs.
To better understand the topic, industrial energy efficiency, it’s important for one to know the basic definitions that are associated with this aspect.
- Energy efficiency improvement is described as decreasing the use of energy per unit service or activity without sustainability affecting the level of these services.54
- Energy efficiency benchmarking is the comparison of the energetic performance of a company with the performance of other companies of other companies working in the same field.55
- Barriers and obstacles to energy efficiency is the factor that explains why energy efficiency measures are not carried out in the industrial sector despite the fact that they are economic according to company criteria.56
- Energy intensity is the amount of energy used per unit of activity or service.57
- Transaction costs are costs occurring to change from one situation to another, such as from the current state to a more energy efficient state.58
New approaches need to address challenges that are focused on the long-term impact that it will have upon future society. Future developments as well as current ones depend upon efforts to improve industrial efficiency that center around manufacturing and the utilities sector. Focusing on patterns in the industrial use of energy will need to be addressed first. Better use of technology that requires less energy to perform the same tasks and functions will enhance energy efficiency. Improving industrial energy efficiency will lead to a reduction in national energy consumption.
According to U.S. Energy Information Administration (Independent Statistics and Analysis) Oklahoma’s leading industries are petroleum and coal products manufacturing, machinery manufacturing, and food manufacturing. “Oklahoma has a total of 3.7 million residents and ranks 29th in the nation in terms of GEP, which is $146.4 billion. In 2008, Oklahoma ranked 18th in the nation’s industrial energy consumption at 558.9 trillion BTU and the 7th in the nation’s industrial natural gas consumption at 259.9 trillion BTU.”59
Data From: http://tonto.eia.doe.gov/state/state_energy_profiles.cfm?sid=OK
| Population and Employment | Oklahoma | U.S. Rank | Period |
| Population | 3.7 million | 28 | 2009 |
| Civilian Labor Force | 1.8 million | 30 | Aug 10 |
| Per Capita Personal Income | $36,917 | 31 | 2008 |
| Industry | Oklahoma | U.S. Rank | Period |
| Gross Domestic Product by State | $146.4 billion | 29 | 2008 |
| Land in Farms | 35.1 million acres | 8 | 2007 |
| Market Value of Agricultural Products Sold | $5.8 billion | 21 | 2007 |
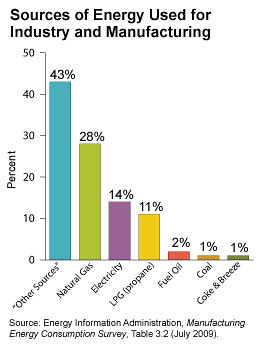
In the Industrial sector of energy there are many different uses and varieties in which energy is used. Other energy sources referred in the graph below show 43% of manufactures use of utilities such as heat, power and electricity generation. Also included in the “Other Sources” category are wood residues from mill processing, steam, pulp from liquor from making paper, agricultural waste, and wood-related paper-related refuse. One primary use is boiler fuel. Boiler fuel is the process in which in producing heat that is transferred to the boiler vessel to generate steam or hot water.
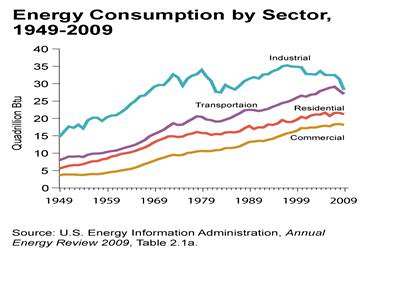
According to the Energy Information Administration website (http://www.eia.doe.gov/energyexplained/print.cfm?page=us_energy_industry) the graph below represents the largest decrease in 2009 compared to 2008 was in the industrial sector, where total energy consumption fell by 10% and fossil fuel consumption fell by 9%. This drop was not surprising, as the industrial sector was particularly hard hit by the recession. While GDP fell by 2% for the Nation in 2009 compared to 2008, real value added for the manufacturing sector fell by 6%.60
Efforts to Improve Industrial Energy Efficiency
The United States Department of Energy has developed a specific program that’s sole purpose is to lead the United States into energy efficiency and productivity. The Industrial Technologies Program’s mission is to transform the method in which the United States industry uses energy by implementing new developments in technology and applying them to existing problems. This government program also supports those developments and research by sharing in the costs. The Industrial Technologies Program is set up into a 3 part strategy:
- Sponsoring research, development, and demonstration of industry-specific and crosscutting technologies to reduce energy and carbon intensity
- Conducting technology delivery activities to help plants access today's technology and management practices
- Promoting a corporate culture of energy efficiency and carbon management within industry.61
This program assesses available technologies for improving energy efficiency and to encourage those technologies to be more widely used. By doing this they have to address the following questions: How does industry use energy? What has the energy trend been and where it appears to be going in the future? Once those concerns are met they can begin to take existing technologies to see how to improve industrial energy efficiency. In doing so, they must determine how much energy they can save. Cost effectiveness is the primary struggle in implementing energy efficient technologies for larger corporations. When energy use is cheap there is no demand to push for other alternatives. Obstacles that restrain operators from making changes are cost of downtown to implement new system, costs of capital, and retraining time. However, as energy rates rise those technologies will become more appealing as they become cost effective, ensuring the benefit will out weight the cost. The cost benefit will depend on the performance, reliability of the equipment and the incentives of switching to something new.
ITP gives customers the reassurance that the Department of Energy (DOE) supports and agrees with the new technology performance in industrial applications. It is important to meet criteria of technology claims, and address critical need in the manufacturing sector. ITP has around 48 late-stage R&D awards between 1991 and 2008. The program has also more than 100 improved technologies that are currently available. ITP has earned more than 150 patents between the years of 1994 and 2007.62
Incentives to Improve Developments in the Industrial Segment
Improving energy efficiency of the industrial sector is expensive and sometimes not guaranteed to work the government has implemented a program that supplies the manufacture or company with initiatives to take that step towards improved energy efficiency. The enhancement of credit terms through federal guarantees allow borrowers to obtain better interest rates than using an alternative means of funding such as private lending markets. The Energy Policy Act of 2005 and the 2007 Energy and Water Development Appropriations Act support commercial use of advanced energy technologies that avoid, reduce, or limit greenhouse emissions and other pollutants.63
For technology and research stages of industrial efficiency private-public part take in cost sharing partnerships. In sharing research and development costs allows new developing products or cost-savings products enable government agencies (ITP) and companies to achieve a broader policy agenda. Administration of federal grants and direct loans in reducing early capital costs are available to some approved companies and organizations. These government loans are not required to be paid back which decreases capital costs tremendously. The federal government offers grants to cover partial or total cost of feasibility studies, demonstrations, or the purchase of new technologies. More times than most these are combined with cost-sharing partnerships.64